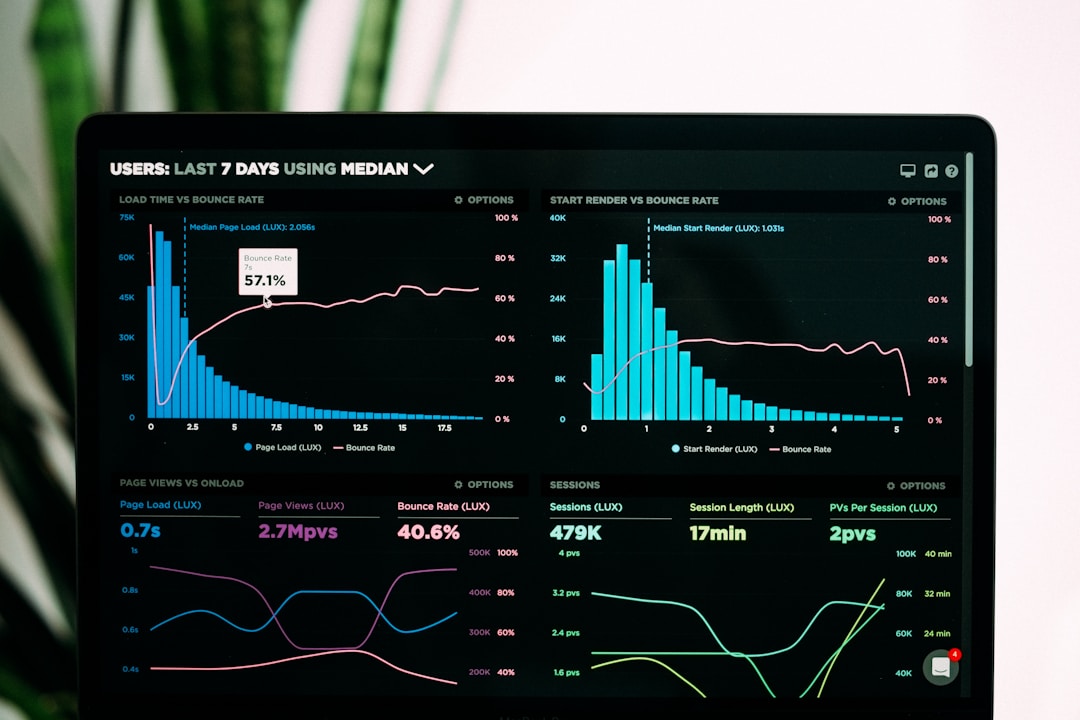
As our world becomes increasingly data-driven, the ways in which we interpret and understand this data are just as significant as the data itself. More often than not, comprehending large volumes of information can be challenging. Enter data visualization, a graphical representation of data and information that simplifies data comprehension and interpretation. At the heart of data visualization are bar charts, a simple yet powerful tool for conveying data in an easily digestible format. In this article, we will explore the impact and importance of bar charts in decision-making.
Contents
Understanding Bar Charts

So, what is a bar chart? A bar chart, or bar graph, is a chart that presents categorical data with rectangular bars with heights or lengths proportional to the values that they represent. The bars can be plotted vertically or horizontally. This fundamental graphic provides a visual, comparative representation of data, making complex data sets easier to understand at a glance.
Bar charts have several components: the axes, the bars, and the data values. The X-axis (the horizontal one) typically displays the categories being compared, while the Y-axis (the vertical one) represents a measured value. Some bar graphs present bars clustered in groups of more than one to display the values of more than one measured variable.
Bar charts are widely used as a visualization tool due to their simplicity and universal comprehension. People from all educational and professional backgrounds can interpret bar charts, making them an effective communication tool. They’re ideal for comparing quantities in different categories because they visually show the difference in quantity right away.
Role of Bar Charts in Data Visualization

Highlighting patterns, trends, and insights in data, bar charts play an integral role in data visualization. Humans process visual information significantly faster than text, and this is exactly where bar charts come in handy. By summarizing large data sets in visual form, they make it easier for the brain to process and interpret the information. This simplicity and ease of use are why bar charts are one of the first tools people utilize when they begin to explore a new data set.
Data visualization isn’t merely about presenting data in a graphical format. It is an essential part of data analysis and business intelligence. It enables decision-makers to see analytics presented visually so they can understand challenging concepts or identify new patterns. By using bar charts, businesses can pinpoint emerging trends, monitor performances, and make data-informed decisions much faster than if the data were presented in rows and columns.
The use of bar charts extends beyond the business world. Whether it’s in healthcare for patient statistics, in finance for revenue streams, or in marketing for campaign effectiveness, these charts simplify complex concepts and condense large volumes of information into easy-to-understand visuals.
Also read: Here’s What an Online Coding Class Really Needs
Use Cases of Bar Charts in Various Industries
Bar charts have found uses across diverse industries. In healthcare, they are instrumental in tracking patient recovery, demographic trends, and disease outbreak patterns. In the technology industry, they’re used for server monitoring, usage statistics, and performance tracking. The finance industry employs bar charts for sales performance tracking, budget allocation, and financial forecasting.
Moreover, bar charts function as a crucial tool for the marketing industry, measuring campaign progress, evaluating audience demographics, and determining target market segments. In education, they visually represent student performances, demographic distributions, and resource allocation, making it easier for educators to understand and describe the data.
The possibilities are indeed endless, demonstrating how versatile and universal bar charts are, irrespective of the industry or type of data.
Altogether, the use of bar charts in data visualization proves to be invaluable in translating big data into comprehensible information that drives decision-making. They embody the saying, “A picture is worth a thousand words.” Bar charts represent data, and they also narrate stories, highlight patterns, and provide a comparative analysis, which is integral in making well-informed decisions across various industries.


